Your business network is like a busy highway on the street, cars (data packets) are flying everywhere, to keep the emails flowing, the applications running, and the customer happy, until something hiccups, your cyber adversary attacks, or one of the devices breaks down and everything comes to a crawling stop. Intelligent traffic police are network monitoring tools, which tirelessly analyse bandwidth usage, suspect suspicious activity like a hacker who is trying to gain access, and provide you with an instantaneous alert before little glitches turn into costly downtime.
These are not some techy equipment that would be of interest to IT people; it is something that an average human being would be interested in, since they have to deal with the online business. They keep a close eye on the real-time performance, predict issues with the help of intelligent analytics, and even make the fixes by themselves, saving you hours of troubleshooting. Imagine reducing your operational expenses by 50 percent, enhancing security without the necessity of toiling it by hand, and having the ability to grow without having to make any manual changes as your business grows- that is the power they unlock.
The most helpful network monitoring software available in the market are going to be discussed in this blog, including free entries like Zabbix and such giants like SolarWinds and PRTG. You will get no end of direct features, prices, and tips of the trade breakdowns to choose the most suitable to fit your arrangement, whether a solopreneur in Delhi or a group of people in India.
What is Network Monitoring?
This is a continually running process of measuring and monitoring the performance, health, and state of a computer network (including routers, switches, servers, firewalls, endpoints, etc.) to detect issues like device failures, bandwidth overload, and packet loss, and to detect latency or security threats in real-time. It utilizes specific hardware and software and is oriented towards collecting the data in terms of such protocols as SNMP or syslog, processing and filtering it to detect anomalies, drawing topology maps, and giving administrators proactive warnings, which enables fast troubleshooting and optimization (on-premise and/or cloud) environments.
Network monitoring is applicable to maintain steady connectivity, minimize downtimes, and find out suspicious activity to enhance security and efficiently allocate resources to ensure smooth operations by tracking metrics like traffic trends, CPU/memory usage, error rates, configuration, and so on. Network Monitoring Tools help in achieving these goals by providing real-time visibility and actionable insights.
What are the Advantages of Network Monitoring?
Network monitoring provides real-time information on the performance of the network and helps organizations know the issues and repair them before they have an impact on the operations. The significant gains will include the proactive approach to problems, the augmentation of security, and cost-effectiveness.
- Proactive Detection: Frequent monitoring of the situation determines the abnormalities and performance deviation at an earlier level, and is able to make prompt actions to avoid the outage. This minimizes the downtimes and ensures a high degree of availability to the users.
- Improved Security: By setting up normal traffic thresholds, clients can identify abnormal traffic, prohibited devices, or other risky processes such as DDoS attacks. A fast response to protect data and compliance can be done by using early warnings.
- Cost Savings: Through increased traffic, wasted resources are eradicated, and emergency solutions are avoided since the businesses will save on hardware and other supporting costs. Automation also eliminates manual labor and leaves the IT to strategize.
- Improved Efficiency: Real-time insights and troubleshooting tools solve issues more quickly and heighten productivity and satisfaction amongst users. Depending on features, like dependency maps and auto-discovery, are easier to manage.
How to Choose The Right Network Monitoring Solution For You?
The choice of a suitable network monitoring solution should be based on significant features, scalability, and integration needs based on your tech stack and network size. Watch out for applications that have real-time monitoring, custom alerts, and high compatibility to scale to your unified infrastructure. This will ensure that issues are identified early enough and performance is maximized.
Key Selection Criteria:
- Scalability: Select a tool that is capable of growing with your network, has expansions across data centers and distributed locations, along with the hybrid cloud environment, without compromising on performance.
- Monitoring Capabilities: Read and write support of multiple protocols and support capabilities (SNMP, streaming telemetry, flow analysis (e.g., NetFlow), and synthetic testing) to be able to have full visibility of traffic, devices, and performance.
- Vendor Compatibility: Choose vendor-neutral options that are able to be compatible with different hardware from Cisco, Broadcom, etc., to combine heterogeneous environments.
Essential Feature
- Notifications and Alerts: Customize personalized alerts more sparingly, send emails in multiple formats (ex, Slack, SMS, email), and act upon a threshold to be able to respond to things quickly.
- User Interface and Ease of Use: Focus on the ease of use, customizable dashboards, customizable views, mobile access, and the speed of the setup, which will reduce training and daily operations.
- Reporting and Analytics: See detailed visualizations, a comparative view of historical data, SLA tracking, and reports that can be released to plan capacity and show reports to the stakeholders.
Additional Considerations
- In-built threat detection (e.g., DDoS, anomalies), role-based access, API, and BI tools, or other system integration.
- Price and Support: Compare open-source pricing (open or commercial), pricing, trial, and support (documentation and forums) made by the vendor.
- Test with Trial: When you are sure that this is the right one, then do a proof-of-concept or a free trial in your environment to be certain.
List of 13 Best Network Monitoring Tools
1. SolarWinds Network Performance Monitor (NPM)
SolarWinds Network Performance Monitor (NPM) is an all-purpose network performance monitoring framework that helps IT departments to monitor the performance of devices, their availability, and failures in a multi-vendor infrastructure, on-premises, hybrid, and cloud deployments.
It uses protocols such as SNMP, ICMP, and WMI to automatically discover and have in-depth visibility into bandwidth usage, latency, packet loss, and uptime, as well as providing tools such as PerfStack to cross-stack correlation and NetPath to hop-by-hop troubleshooting to help identify problems quickly. NPM, which is built on the Orion Platform, offers customizable dashboards, smart alerting, and automated network mapping to make management easier and lower the downtime.
Key Features:
- Topology mapping and automatic network discovery of Layer 2 /3 with Network Atlas to be visualized.
- PerfStack performance data correlation timelines.
- NetPath critical path hop-by-hop to providers, cloud services.
- Access point wireless heatmap and Wi-Fi surveillance.
- More developed alerting, including baselines, QoE dashboards, and syslog/SNMP tap management.
- Poller Universal Device Custom metrics and report generation.
Pricing:
- Monitoring & Observability :Starts at:$7 Per node/month
- Database: Starts at:$142 Per database/month
- IT Service Management: Starts at:$39 Per technician/month
- Incident Response: Starts at:$9 Per user/month
Website:https://www.solarwinds.com/network-performance-monitor
2. LogicMonitor
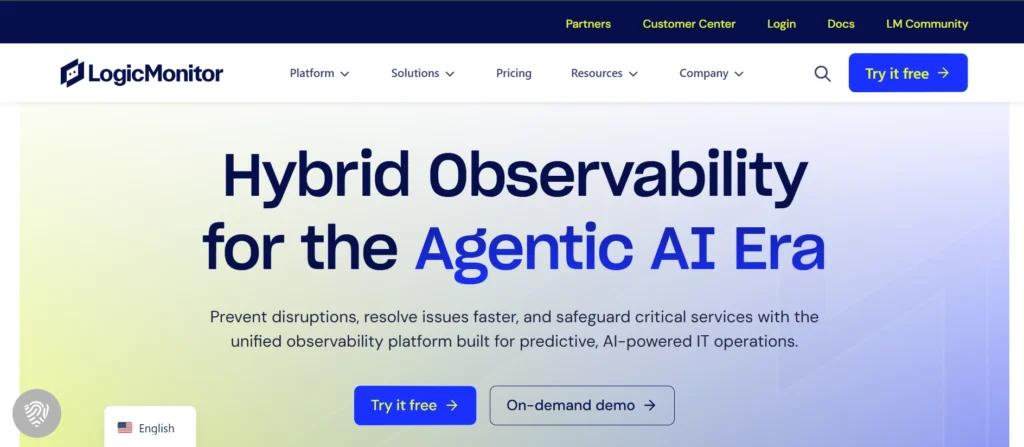
LogicMonitor is an AI-powered hybrid observability/monitoring engine that is cloud-based and aimed at providing the IT operations team with a visualization of multi-environment infrastructures (on-premises servers, cloud services, each including AWS, Azure, and Google Cloud) and containers, networks, and applications.
It will automatically identify devices, collect real-time performance metrics, detect anomalies using machine learning, perform root cause analysis, and enable proactive resolution of incidents using automated workflows and multi-cloud features like Edwin AI, and help organizations to reduce mean time to resolve (MTTR), minimize downtime, and maximize resource usage in hybrid and multi-cloud environments. Network Monitoring Tools
Key Feature
- Uninterrupted monitoring will be employed to autodiscover and deploy servers, networks, cloud services, and containers using the architecture-based methods of automated discovery and deployment.
- Hybrid IT data visualization 360 view, personalizable dashboards, and real-time analytics.
- AI/ML drives anomaly detection, analysis of root cause, and resolution automation, including Edwin AI to provide proactive support.
- Multichannel notification, performance levels, artificial surveillance, and predictive analytics to prevent issues.
- The log intelligence, monitoring of APIs, and integration with other solutions like ServiceNow facilitate easier incident management.
Pricing:
- Essentials: $16 per hybrid unit
- Advanced: $27 per hybrid unit
- Signature + Edwin AI: $53 per hybrid unit
Website:https://www.logicmonitor.com
3. Datadog Network Monitoring
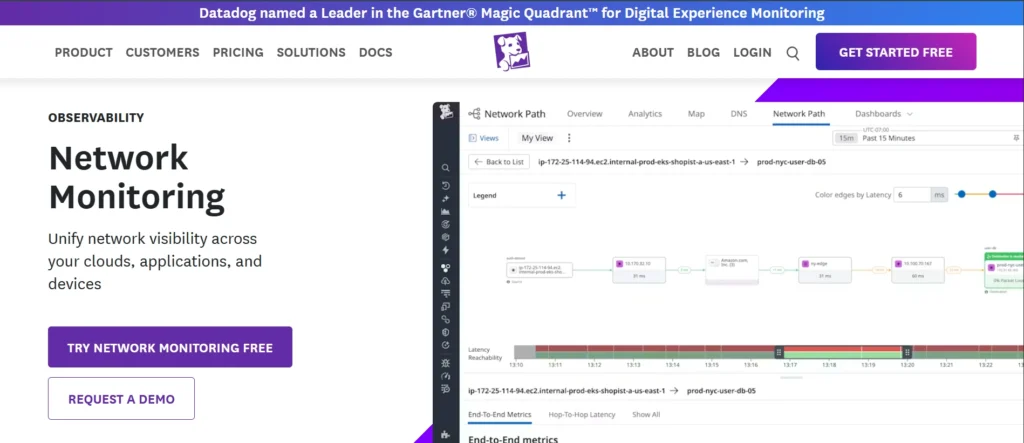
Datadog Network Monitoring is a strong observability product, developed by Datadog, that offers real-time visibility on the health of a network, either in a hybrid or multi-cloud setup or on-premises, to assist teams in observing the health of devices, traffic, and application-layer interactions. It has machine-learning-based anomaly detection (to identify latency spikes or packet loss), network events to infrastructure metrics, logs, traces, and APM data, thus automatically mapping network topologies and detecting the occurrence of an anomaly, and root-cause analysis is faster to perform.
This tool has been particularly beneficial to DevOps and network engineers who deal with complex infrastructures, particularly those related to thousands of devices of any vendor, since it can automatically support thousands of device types with no configuration, and provides easy-to-use dashboards, service maps, and alerting to prevent outages before they can have any effect on users.
Key Features:
- Network Device Monitoring (NDM) of the inventory of hardware of any vendor, which is automatically detected.
- Live Network Map dependencies, hosts, containers, and live traffic.
- CNM to achieve granular visibility of microservices, Kubernetes pods, and multi-cloud traffic, on the foundation of eBPF and SNMP.
- Proactive detection of problems (significant congested ports, failures) with the help of machine learning.
- APM, traces, APM, and dashboards Correlated observability.
Pricing:
- Free: Starting At $ 0
- Pro: Starting At $ 15 Per host per month
- Enterprise: Starting At $ 23 Per host, per month
Website:https://www.datadoghq.com/product/network-monitoring/
4. Paessler PRTG Network Monitor
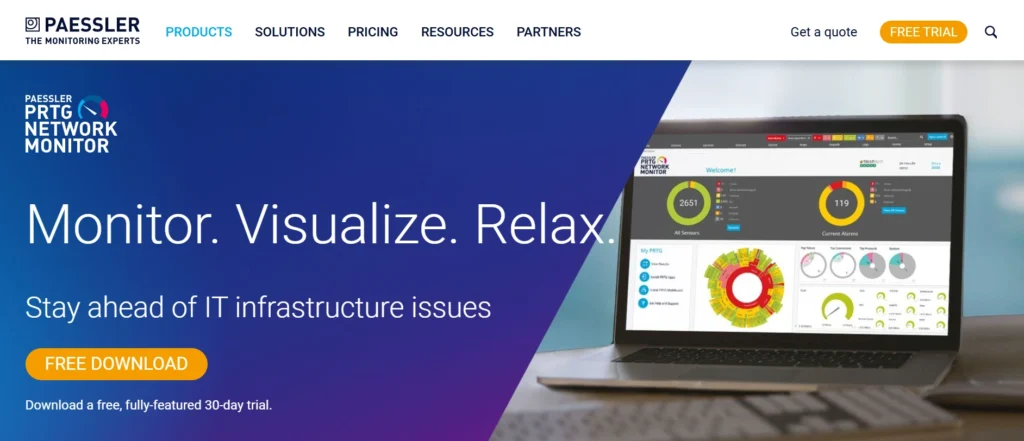
Paessler PRTG Network Monitor is a multi-agentless network monitoring package and is intended to monitor the performance, availability, and health of IT, OT, and IoT systems and infrastructure, i.e., servers, routers, switches, firewalls, virtual machines, applications, websites, and environmental sensors in on-premises, cloud, or hybrid systems.
It uses a model of a flexible sensor-based system with every sensor tracking a particular metric (e.g., CPU load, bandwidth, disk space), though generally 5–10 sensors per device are utilized, and more than 250 default sensors are available to enable rapid configuration through auto discovery and smart wizards. Network Monitoring Tools provide scalability between small and large networks with real-time dashboards, customizable maps, alerting, reporting, and scalability without the need to use complex configurations. It is easy to use and has been designed to provide an IT administrator with a unified view of the network.
Key Features:
- Real-time visual overviews and automatic network discovery and mapping to discover devices.
- Monitoring metrics such as traffic, CPU, memory, response times, and hardware status with sensor-based metrics, of which there are more than 250 sensor types.
- Ad hoc dashboards or alerts (email, SMS, push), reports (HTML/ PDF), and flexible triggered notifications.
- Monitors multiple locations, traffic, backup, and configuration as well as custom sensors via API.
- Multi-platform access through web interface, desktop application, or iOS/Android-based mobile applications, auto-updates, and failover clustering.
- Agentless work with inbuilt database, webserver and common device templates
Pricing:
- PRTG 500:$179 per month paid annually
- PRTG 1000:$325 per month paid annually
- PRTG 2500::$675 per month paid annually
- PRTG 5000:$1,183 per month paid annually
- PRTG 10000::$1,492 per month paid annually
Website:https://www.paessler.com/prtg
5. Infraon NMS
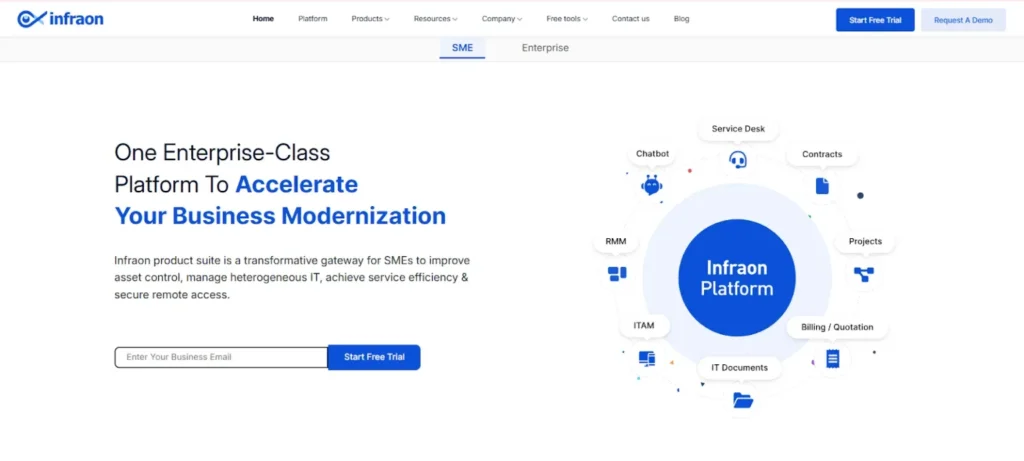
Infraon NMS is an intelligent network monitoring and management software designed to give IT Operations teams complete visibility and control over multi-vendor network infrastructures. It helps organizations monitor switches, routers, servers, and cloud or hybrid network environments in real time, detect anomalies, and resolve incidents quickly using automated workflows.
Infraon NMS provides automated network discovery, 360° topology visualization, customizable dashboards, SLA monitoring, and intelligent event management. Its AI-driven incident correlation engine and prebuilt workflows allow IT Operations teams to identify and resolve over 80% of network-related tickets with a single click. The solution also supports multi-vendor inventory management, QoS tracking, and integration with ITSM tools, making network operations and broader IT Operations more efficient and reliable.
Key Features
- Automated discovery and deployment of network devices and services across on-premises, cloud, and hybrid environments.
- Real-time network performance monitoring, fault management, and predictive analytics.
- AI-powered incident correlation and single-click resolution of most network tickets.
- Customizable dashboards, interactive reports, and SLA compliance tracking.
- Multi-vendor inventory management and integrated ITSM workflow support.
Pricing
Infraon NMS offers custom pricing based on the number of devices and organizational requirements. You can start with a free trial to explore features and scalability.
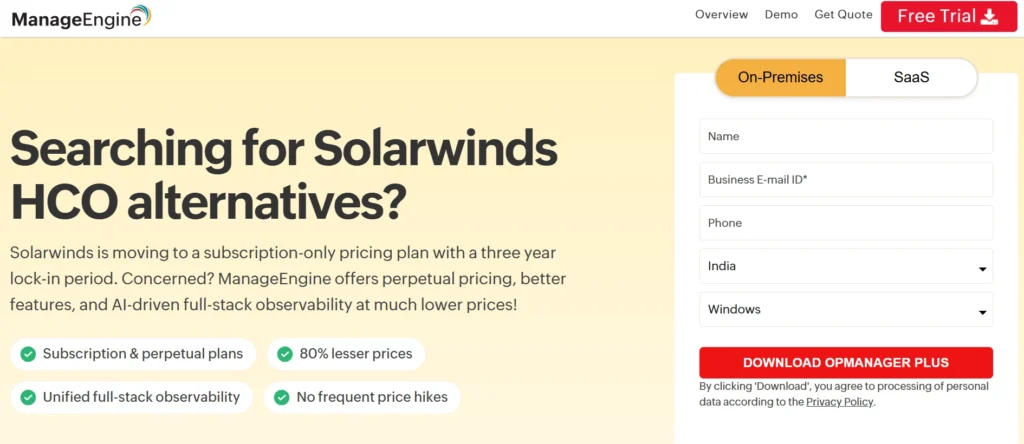
6. ManageEngine OpManager

ManageEngine OpManager is a powerful, integrated network monitoring application of Zoho ManageEngine network of products aimed specifically at IT administrators and IT operations departments to have an overall view of the entire IT infrastructure. It tracks key components such as routers, switches, firewalls, servers, virtual machines, printers and applications in physical, virtual, and hybrid environments, which are tracked using protocols such as SNMP, ICMP, and WMI to gather real-time information.
The software is also strong in detecting faults and troubleshooting, whereby events are correlated, and root cause analysis is done to minimize downtimes with customizable dashboards, Layer 2/3 topology maps, and predictive analytics to optimize capacity planning and performance. It is deployed by enterprises, SMBs, and MSPs and supports more than 10,000 types of devices across a variety of vendors, and it can be integrated with other tools such as ServiceDesk Plus to provide a comprehensive experience in the management of IT operations.
Key Features:
- Live tracking of network devices and servers, bandwidth, and applications.
- Dedicated notifications, escalations, and warnings to address the problem proactively
- Root and fault cause analysis with automated remediation workflow.
- Performance trends and capacity planning reporting, analytics, and dashboards.
- Compliance and configuration management, Server, VM, and storage monitoring.
- Layer2 maps, bandwidth analysis map, and multi-vendor support through 8000+ templates.
Pricing:
- OpManager has a free version, 30 days free trial, and perpetual licenses depending upon the number of devices:
- Professional version: This version begins at $1233 of 50 devices
- Enterprise Edition: $19,995 on 1,000 devices (custom quotes on bigger requirements).
- Further 20 percent yearly maintenance and support (AMS) charge.
Website:https://www.manageengine.com/network-monitoring/opmanager.html.
Suggested Customer Engagement Tools
7. Auvik
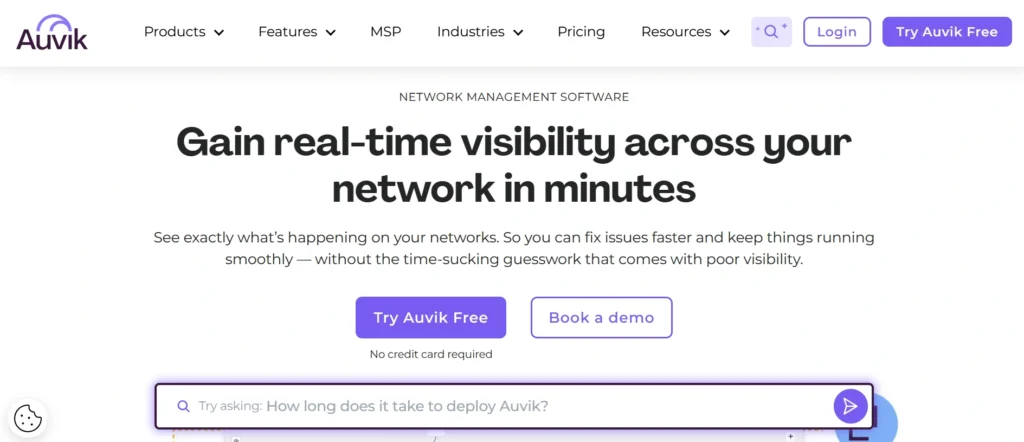
Auvik is a powerful and cloud-based network monitoring and management platform designed to support the requirements of the IT departments, managed service providers (MSPs), and businesses with multi-site and complicated networks. Network Monitoring Tools like Auvik assist in removing the manual process of documentation, and provide real-time visibility into device health, traffic patterns, configuration, and performance indicators without having to install costly on-premise devices by automating network discovery, mapping, and inventory collection.
To identify changes in real time, agentless deployment (SNMP, WMI, NetFlow, API integrations) is used to identify anomalies (outages, bandwidth hogs, etc.) and to offer actionable insights to troubleshoot, plan capacity, and harden security can be done quickly, all in a central dashboard at Auvik.
Key Features:
- Automation Network topology Detection, mapping Automatic detection and mapping of the network Topology and representation The network topology and its devices, connections, and configurations are represented automatically in visual form.
- Monitors, alerts, and notifications of issues, including the device being offline, high CPU usage, or bandwidth issues.
- Configuration of network devices, control of backup, version, and change tracking.
- Bandwidth and traffic, and application optimization tools.
- Threats and unauthorized devices, along with vulnerabilities, are identified using encryption like AES-256 and TLS.
- Automation: Automated functions such as backups, updates, or integration with other systems such as ConnectWise or Autotask.
- Client portal to provide reports, dashboards, and performance statistics to the end-users.
- Unlimited users, sites, and non-billable endpoints (e.g., printers, IoT) API access.
Pricing:
- MSPs are eligible to receive enterprise pricing: a 14-day free trial requires no credit card.
Website:https://www.auvik.com
8. Site24x7 Network Monitoring
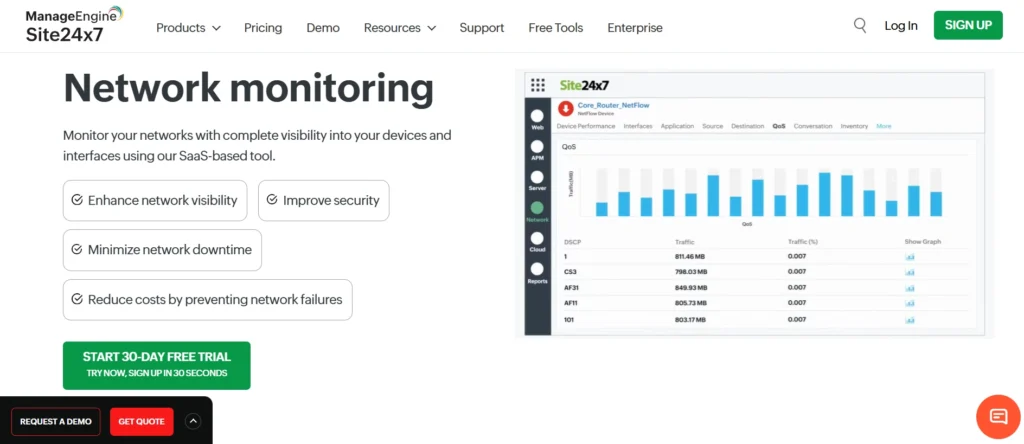
Site24x7 Network Monitoring is an agentless SaaS application that is a cloud-based application and provides end-to-end visibility of the availability, health, and performance of network devices, interfaces, servers, and traffic, both in LAN, WAN, and also in hybrid networks.
It also supports SNMP protocols, IP range / CIDR-based auto-discovery, and a local poller to safely collect the data that can be monitored and alerted with thresholds and topology mapped over over 11,000 device types of 450 different vendors like Cisco and Juniper. The platform ensures the encryption of data, compliance with ISO 27001 and SOC2, and connects to such tools as Slack or ServiceNow to fix the problem before it starts.
Key Features:
- SNMP Discovery of devices in IP ranges or networks is automatic.
- Multi-vendor support (450+ brands and 11,000 templates (routers, switches, firewalls, and UPS)).
- Network traffic analysis using NetFlow, sFlow, and flow protocols and topology mapping.
- Plugged threshold warnings, escalation policy, and compliance administration.
- Wireless, storage, printer, load balance,r and WAN accelerator monitor with the use of a GPU.
- One can use secure clouds wherever they are, and the data transfer is encrypted.
Pricing:
- Lite:₹810/month paid annually
- Professional: ₹3,780/month paid annually
- Enterprise: Starts at ₹56,250/month paid annually
Website:https://www.site24x7.com/network-monitoring.html
9. Nagios (Core/XI)
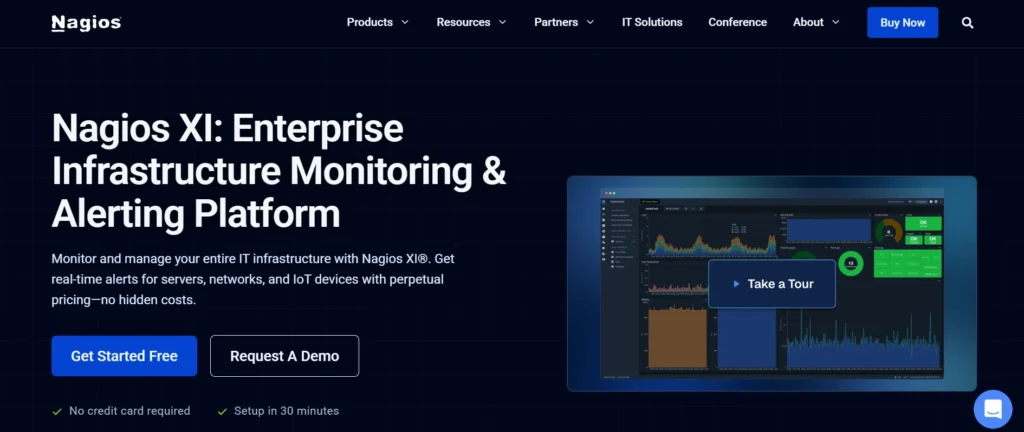
Nagios Core is an open-source monitoring solution for IT infrastructures to observe the availability, performance, and health of networks, servers, services, applications, and endpoints by linking with monitoring through the utilization of a multitude of plugins to identify the state of the object and provide notices. Nagios XI is a professional and refined version of Core; it is more advanced with automation, can handle large networks, and has a user-friendly web interface so that its deployment, management, and visualization of the monitoring process do not need a lot of configuration tweaking.
The two versions are usable in terms of preventing downtime since they can detect issues in their early stages, yet XI offers a broader range of business intelligence, including predictive analytics and SLA monitoring. Network Monitoring Tools like these help organizations improve reliability and efficiency.
Key Features:
- Real-time host, service, and network utility monitoring.
- Personalized dashboards, reporting, and visualizations ( XI-exclusive).
- Email, SMS, SNMP trap, and script notification.
- Performance graphing and discovery, automated.
- Thousands of community extensions in sight.
- Multi-network support, capacity planning reports, and SLA reports (XI).
Pricing:
- Free
- 7 Nodes / 100 Services — $0
- Standard
- 50 Nodes — $1,995
- 100 Nodes — $2,595
- Unlimited — Custom (contact sales)
- Enterprise
- 50 Nodes — $3,990
- 100 Nodes — $4,690
- Unlimited — Custom (contact sales)
- Sitewide
- Multiple Unlimited — Custom (contact sales)
Website:https://www.nagios.com/products/nagios-xi/
10. Zabbix
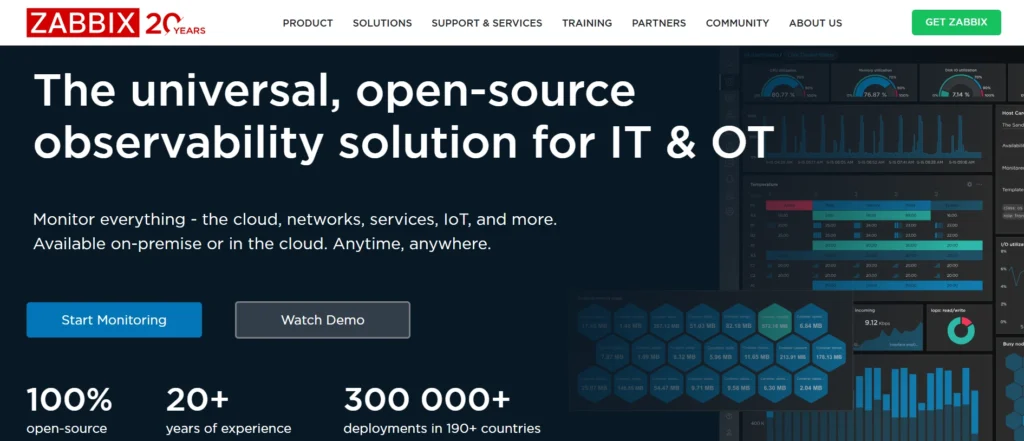
Zabbix is an open-source tool that enables the monitoring of IT infrastructure (networks, servers, cloud environments, virtual machines, and applications) across a very broad range of ecosystems and is intended to be enterprise-grade. It does it by using agents or agentless checks to retrieve availability, performance, and security real-time values and registers the data in databases like MySQL or PostgreSQL to be analyzed using easy-to-use web dashboards, graphs, and maps.
It has discovery, alerting, and visualization, which makes it easy to scale to find millions of items under management by proxies as well as predictive analytics, SLA tracking, and integrations with other tools, like Grafana or Slack.
Key Features:
- Monitored devices, services, and applications discovered and templated automatically.
- Escorated and auto-remediation improved alerting and notification by different mediums (email, SMS, scripts).
- Root cause analysis and visualization that provides customizable dashboards, graphs, maps, and reports
- Distributed architecture and proxies with support for millions of metrics across the world.
- Strict security, encryption, multi-factor authentication, audit logs, and role-based access.
- Expandable with REST API, webhook, automation, and integrations.
- inventory autocollection, SLA monitoring service trees, long term trend stores.
Pricing:
- Open Source: Fully open-source with no limits on features, hosts, or metrics
- Pricing: Starts around $1,600/year for basic packages
- Enterprise Options: Zabbix SIA offers enterprise consulting and premium support
- Trial & Demo: Free trial and live demo available
Website: https://zabbix.com.
11. WhatsUp Gold
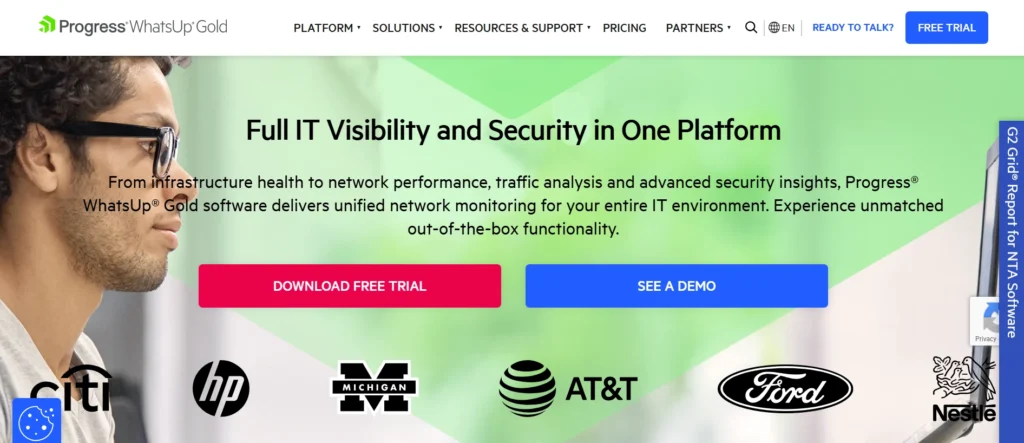
WhatsUp Gold is an extremely scalable network monitoring and management software created by Progress Software to give IT administrators an end-to-end visibility and control over complex IT situations, including hardware in the on-premises, virtual environment, cloud computing, and hybrid environment. It is the best in automated discovery of network devices by using protocols like SNMP, WMI, CDP, and creates dynamically updating topology maps in real-time to reflect the changes, and also continuously polls on measures of performance such as CPU utilization, bandwidth usage, and uptime, and the health of the applications.
It is a simple interface based on an easy-to-use, customizable dashboard. Network Monitoring Tools provide proactive alerting features through a variety of channels (email, SMS, Slack), and automated recovery actions, which reduce the mean time to resolution (MTTR) and make it valuable in organizations, with the goals of preventing outages and improving resource management.
Key Features:
- SNMP-based Layer 2 / 3 discovery and interactive network mapping. Automated protocol-based network mapping to a comprehensive infrastructure view. Active SNMP-based, CDP-based, and other protocol-based network mapping.
- Real-time performance of monitoring devices, servers, applications, bandwidth, and wireless clients with historical information about its performance and customizable dashboards.
- Automated smart alerting, notifications, and workflows coupled with tools like Progress Flowmon in an attempt to have faster mean time to resolution (MTTR).
- Virtual environment support, configuration management, and the detection of rogue wireless devices.
- Scalability to 100k + devices and various installations, professional reporting, and policy-controlled activities.
Pricing:
- Pricing: No published price list; pricing is customized
- By Device: Premium Edition — monitors unlimited points per device
- By Points: Total Plus Edition — allocates points for complex monitoring
Website:https://www.whatsupgold.com
12. NinjaOne (formerly NinjaRMM)

NinjaOne (formerly called NinjaRMM) is an MSP and amicable to the IT department based cloud-based remote monitoring and management (RMM) solution that is designed to provide an effective remote monitoring and management of Windows, macOS, Linux, and even partially mobile equipment.
Having been launched as NinjaRMM (renamed to NinjaOne in 2022), it is an automation-based, real-time data-oriented, and scalability-oriented platform to minimize manual IT efforts, reduce downtime, and improve security posture, and requires no on-premise infrastructure. It assists organizations in leveraging thousands of devices throughout the world as it combines monitoring, patching, distance control, and reporting features in one simple-to-use dashboard and aids in compliance and cost efficiency.
Key Features:
- Live performance and monitoring, disk space, and CPU custom alerting.
- Automatic and rollback OS and third-party software patching.
- Defend intrusion and management of remote access.
- Hardware and software. IT asset inventory tracking.
- PowerShell, Python, and Bash automation scripting for maintenance.
- Backup systems and endpoint protection.
Pricing;
- Endpoint Range: 10,000 up to 50 or fewer, depending on volume, geography, and add-ons (like integrations)
- Pricing Per Device (First Year):
- 10,000 endpoints — up to $1.50 USD per device
- 50 endpoints — up to $3.75 USD per device
- Additional Charges: No unusual or hidden fees
Website:https:// ninjaone.com/
13. Domotz
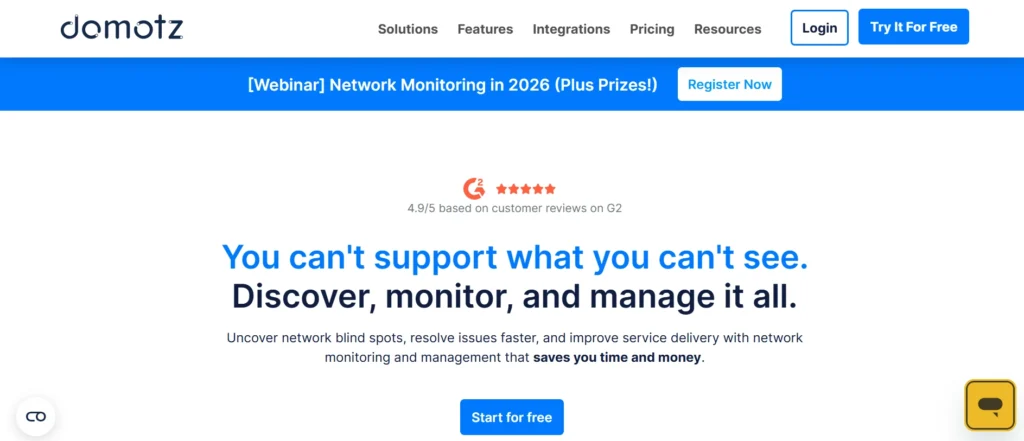
Domotz is a very powerful agentless network monitoring solution that allows the IT departments, managed care providers (MSPs), and system administrators to have full visibility of the distributed IT infrastructures in various locations without necessarily installing software and hardware on-premises or with complex configurations. It can automatically scan and map all of the varied connected resources, i.e., routers and switches, servers, IoT devices and endpoints, and measure the key metrics, i.e., uptime, bandwidth usage, CPU/memory usage, and service health (e.g,. HTTP, DNS, VPN) by placing a small software agent on a local device.
Those who are in violation of the threshold or outage messages are sent in real time to users through email, SMS, Slack, or integration and can be troubleshooted remotely with the use of built-in utilities such as terminal access, power controls, and packet captures, all on a single cloud dashboard. Network Monitoring Tools enable this level of centralized monitoring and quick response.
Key Features:
- Identification of devices in the network and overlaying the network topology to obtain a complete view.
- Performance real-time monitoring, e.g., bandwidth usage, availability, outage, or anomaly alert.
- Remote management of troubleshooting devices like switches, routers, and servers without necessarily going to the location.
- Any customizable dashboards, data processing, and automation of data using third-party applications.
- Others are agentless with a lightweight collector application, and the historical data is stored in the cloud.
Pricing:
- For discovery and visibility: Domotz Free £0 +1 Free Managed Device
- For monitoring and management: Domotz Pro £1.50 per Managed Device/month
Website:https://www.domotz.com
Comparison Table
| Tool Name | Price (Starting) | Free Plan | Best For |
| SolarWinds NPM | $7 per node/month | No | Multi-vendor hybrid environments |
| LogicMonitor | $16 per hybrid unit | No | AI-powered hybrid observability |
| Datadog | $15 per host/month (Pro) | Yes ($0) | Complex multi-cloud infrastructures |
| PRTG | $179/month (500 sensors) | Yes (limited) | IT/OT/IoT scalability |
| ManageEngine OpManager | $1,233 (50 devices) | Yes | Unified IT infrastructure monitoring |
| Auvik | Custom (MSP pricing) | 14-day trial | Multi-site MSP network management |
| Site24x7 | ₹810/month (Lite) | No | End-to-end hybrid network visibility |
| Nagios | $0 (Core); $1,995 (XI 50 nodes) | Yes (Core) | Large-scale open-source monitoring |
| Zabbix | $0 (open source); $1,600/year support | Yes | Enterprise-grade distributed IT |
| WhatsUp Gold | Device-based (custom) | No | Scalable hybrid network control |
| NinjaOne | $1.50-$3.75 per device | No | Remote endpoint management |
| Domotz | £0 (Free); £1.50/device (Pro) | Yes | Agentless remote troubleshooting |
Conclusion
Small businesses can use network monitoring software like SolarWinds, LogicMonitor, PRTG, Zabbix, or any of the systems that include 24-hour data presentations, proactive alerts, and auto-troubleshooting and resolutions to ensure that their networks operate at full power, with minimal downtime, increased security, and lower costs, as much as half.
However, whether you choose a free open-source solution like Zabbix or a more robust paid version like Datadog, the biggest factor in choosing a scalable application is finding one with an easy-to-use dashboard, multi-vendor support, and AI-assisted anomaly detection that matches your environment as it continues to grow and evolve. Network Monitoring Tools like these can help turn potential network headaches into smooth sailing productivity. Get a free trial today to experience the benefits.
FAQs
Q.1 What is Network Monitoring?
Network monitoring Network performance Network health and status can be monitored to detect performance and health problems in computer networks like routers, switches, servers, firewalls, bandwidth overload, packet loss, latency, or security attacks in real-time by monitoring protocols like SNMP or syslog.
It collects, creates anomalies, creates topology maps, and gives proactive alerts to take a fast route of troubleshooting on-premise or cloud systems.
Q.2 What are the Main Advantages?
The key benefits are automatic identification of problems and reduction of downtimes, increased protection against threats like DDoS, optimization of resources, and improved efficiency through real-time information and automation.
Q.3 What Should be the Correct Tool?
Specifically in regard to scalability to accommodate growing networks, support capabilities (e.g., SNMP support, NetFlow support, etc.), vendor support (e.g., Cisco support), and features (e.g. easy-to-use dashboards, custom alerts, etc.).
Q.4 What are the Important key Characteristics?
Ask announcements on Slack/SMS/email, interfaces that are graphical with mobile access and reporting/analytics to trends, and automatic discovery of topology mapping.
Q.5 What is SolarWinds NPM?
SolarWinds Network Performance Monitor includes automatic discovery, PerfStack timelines, NetPath troubleshooting, and customized multi-vendor network dashboards starting at 7 per node/month.
Q.6 How does PRTG Differ?
The metrics sensors of PRTG include CPU, bandwidth, real-time maps, and mobile applications, and cost 179/month with 500 sensors.
Q.7 Is Zabbix a Good Free Option?
Zabbix is open source and supports millions of metrics, auto-discovery, alerting, and dashboards. Zabbix is open source, and there is a paid support option, which is approximately $1600/year.